Market Liquidity Turns Negative for First Time Since 2021
This image is used under our Editorial Policy.
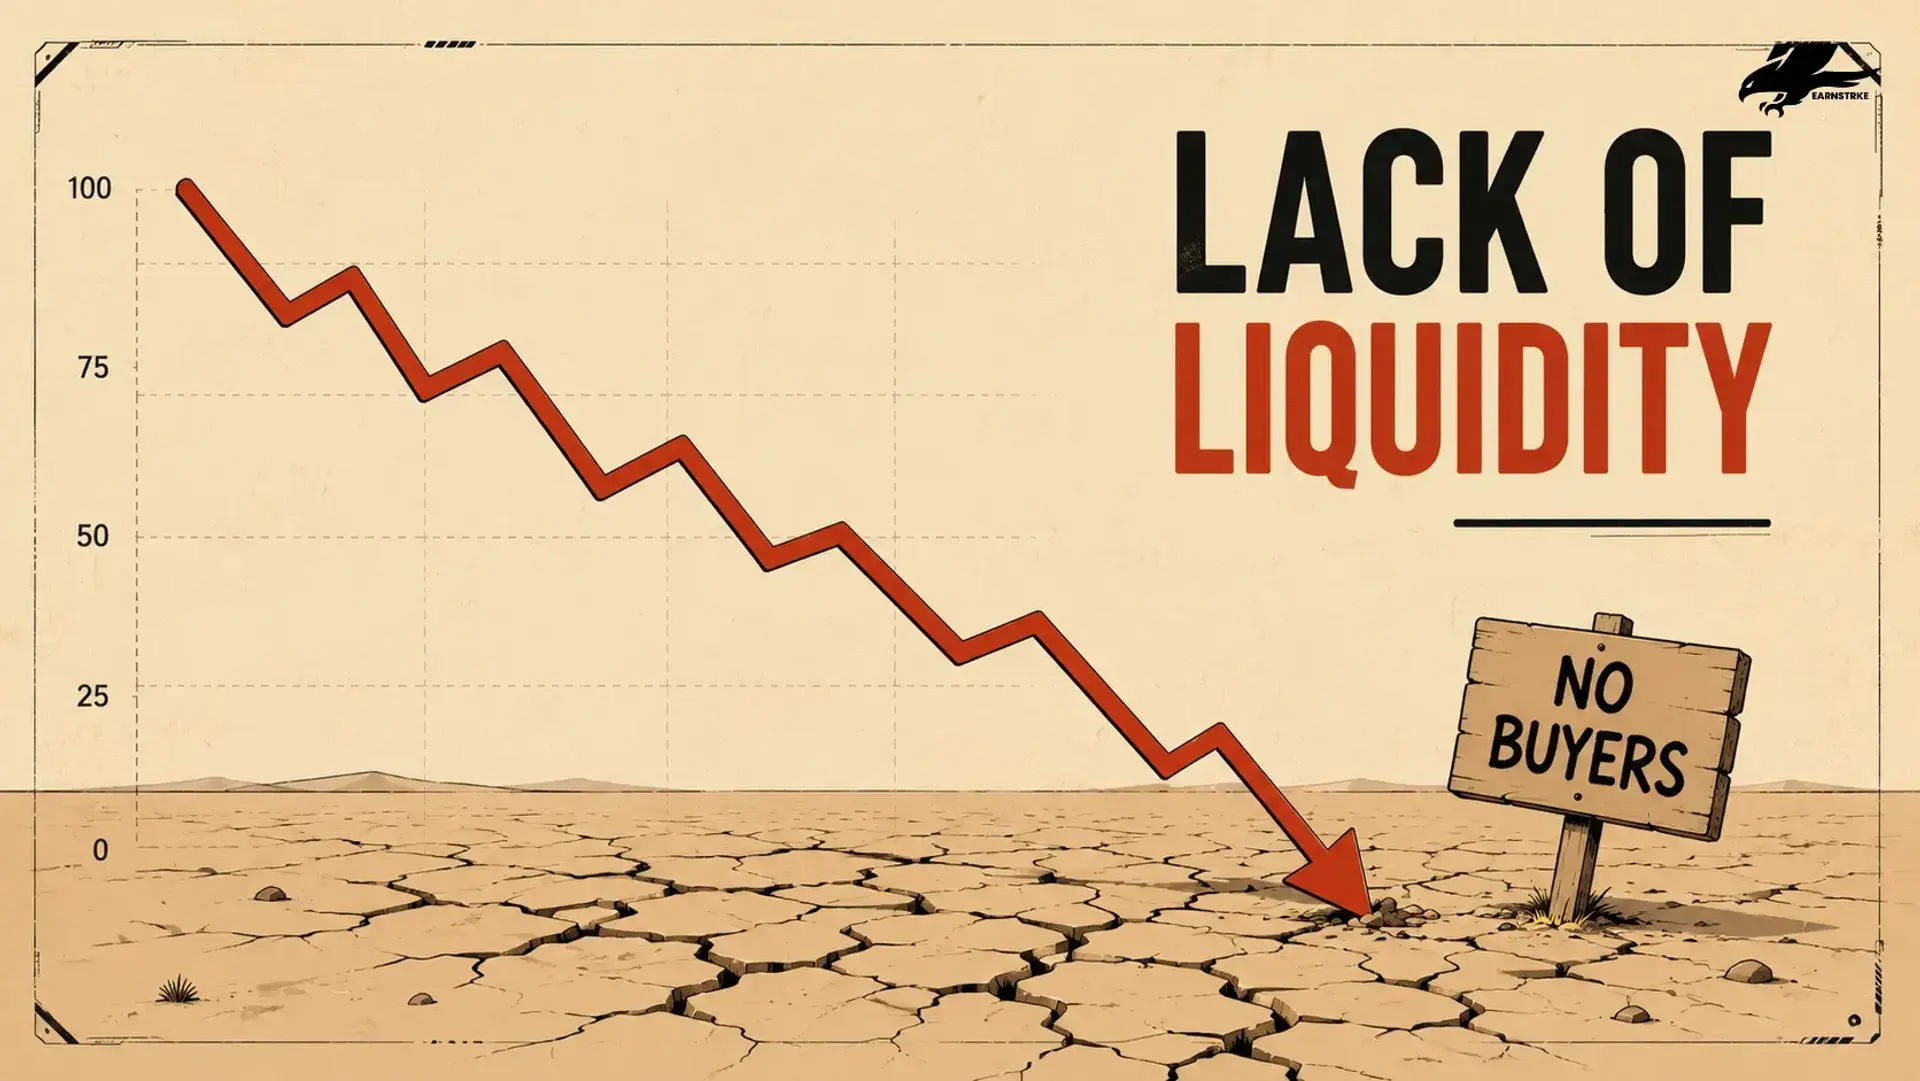
Excess liquidity, a Bloomberg-tracked gauge of surplus cash available to flow into financial markets, turned negative in mid-June 2026 for the first time since 2021, even as U.S. equity ETFs recorded their second-highest weekly inflow on record, creating a widening gap between fading market support and rising retail demand.
Two things are happening at once, and they're moving in opposite directions. The cash that normally cushions stock prices is disappearing. The money chasing stocks anyway just hit one of its strongest weeks ever. That mismatch is the actual story here, more than either trend on its own.
What Is Excess Liquidity and Why Did It Turn Negative?
Excess liquidity, as defined by Bloomberg strategist Simon White, is calculated by taking money supply growth across the economy and subtracting inflation and economic growth. What's left over is the surplus cash that historically flows into stocks once the economy's basic needs are funded.
When that number is positive, there's spare capital looking for a home, and risk assets tend to benefit. When it turns negative, as it just did for the first time since 2021, there's no surplus left. The real economy and inflation are now absorbing money supply growth as fast as it's created, leaving nothing extra to push into equities.
The historical pattern is consistent: declining excess liquidity typically causes the yield curve to flatten, a pattern where the gap between short-term and long-term interest rates narrows, and that flattening has preceded weaker stock returns over the following three to six months.
Is the Federal Reserve Causing This Tightening?
Not directly, and that distinction matters. Kevin Warsh ran his first Federal Reserve meeting as chairman just days ago and delivered a hawkish tone. But the market had already been pricing in tighter conditions throughout 2026, well before that meeting happened. The Fed is catching up to a shift the bond market started pricing in months earlier.
The mechanism driving this is more subtle than a rate hike. Two separate rates explain it:
- The neutral rate, the interest rate level where money is neither cheap nor restrictive, has been climbing as heavy AI-related capital spending pushes up borrowing costs broadly across the economy
- The terminal rate, the peak level markets expect the Fed to eventually reach, has been climbing even faster than the neutral rate
As the gap between those two rates narrows, monetary policy becomes more restrictive in practice, without the Fed announcing a single new hike. Money simply becomes harder to access.
Is This Just a U.S. Problem, or a Global One?
It's global, and war-related inflation is making it worse. A global index tracking central bank rate hikes has started falling, signaling that tightening pressure is spreading well beyond the United States. Inflationary pressure driven by ongoing geopolitical conflict is pushing central banks worldwide toward more hawkish positioning. Futures markets are now pricing in additional global tightening ahead, not a pause.
That global synchronization matters because it removes one of the usual escape valves. When liquidity tightens in just one region, capital can often rotate toward looser conditions elsewhere. When tightening is happening broadly across major central banks at once, that rotation option narrows.
Are Stocks Already Priced for a Liquidity Crunch?
No, and that's the part creating real risk. The relative valuation between stocks and bonds currently sits at the 95th percentile of more than 50 years of historical data. Stocks are expensive relative to bonds by almost any historical comparison available.
Supply pressure is adding to the squeeze:
- Net U.S. equity supply, new shares issued through IPOs and secondary offerings minus shares bought back, has turned positive for the first time since the pandemic
- U.S. equity ETFs just recorded their second-highest weekly inflow ever recorded
Those two facts sitting together is the core tension. More new shares are hitting the market right as the surplus cash that normally absorbs them is disappearing, and retail investors are buying at one of the fastest paces on record into that exact gap.
What's the Angle Most Coverage Is Missing?
Most coverage treats this as a binary: either liquidity tightening crashes the market, or retail buying proves the bull case is still intact. The more useful read is that retail flooding in during a liquidity contraction is itself historically a late-cycle signal, not a contradiction of the liquidity data.
Retail investors have historically been the most aggressive buyers in the final stretch of a bull market, precisely because sentiment lags fundamentals. When increasing capital chases returns at the same time underlying liquidity support is fading, markets have often entered what analysts describe as a sentiment-driven blow-off phase before a correction, rather than a sign the rally has structural staying power. The AI infrastructure spending driving much of this market's gains is real and well-documented in corporate earnings. But real earnings growth and a liquidity-starved, overvalued, oversupplied equity market aren't mutually exclusive conditions. Both can be true at the same time, and right now, both appear to be.
FAQ
What does it mean when excess liquidity turns negative?
Excess liquidity measures surplus cash left over after subtracting inflation and economic growth from money supply growth. When it turns negative, there's no extra capital available to flow into stocks beyond what the real economy is already absorbing, historically a precursor to weaker equity returns over the following three to six months.
Is the Federal Reserve responsible for this liquidity tightening?
Not primarily. New Fed Chair Kevin Warsh adopted a hawkish tone in his first meeting, but the bond market had already been pricing in tighter financial conditions throughout 2026. The Fed's stance is catching up to conditions the market established earlier, rather than initiating the tightening itself.
Why are stocks considered expensive right now despite the liquidity warning?
The valuation ratio between stocks and bonds currently sits at the 95th percentile of more than 50 years of historical data. That means stocks are priced richly relative to bonds by almost any historical measure, even as the liquidity that typically supports those valuations is contracting.
Why does retail investor buying matter if liquidity is tightening?
U.S. equity ETFs recently posted their second-highest weekly inflow on record, even as institutional liquidity support faded. Historically, heavy retail buying late in a market cycle has coincided with reduced underlying support, a pattern analysts associate with sentiment-driven rallies nearing their final stage rather than sustainable strength.
Is this liquidity tightening happening only in the United States?
No. A global index tracking central bank rate hikes has begun falling, signaling that tightening conditions are spreading internationally, partly driven by inflation tied to ongoing geopolitical conflict. Futures markets are pricing in further global tightening, suggesting this isn't isolated to U.S. monetary policy.
The content on this page is provided for informational and educational purposes only and should not be considered financial or investment advice. Please read our Disclaimer for additional information.