Gold Rebounds Above $4,000 But the Real Story Is Who's Buying
This image is used under our Editorial Policy.
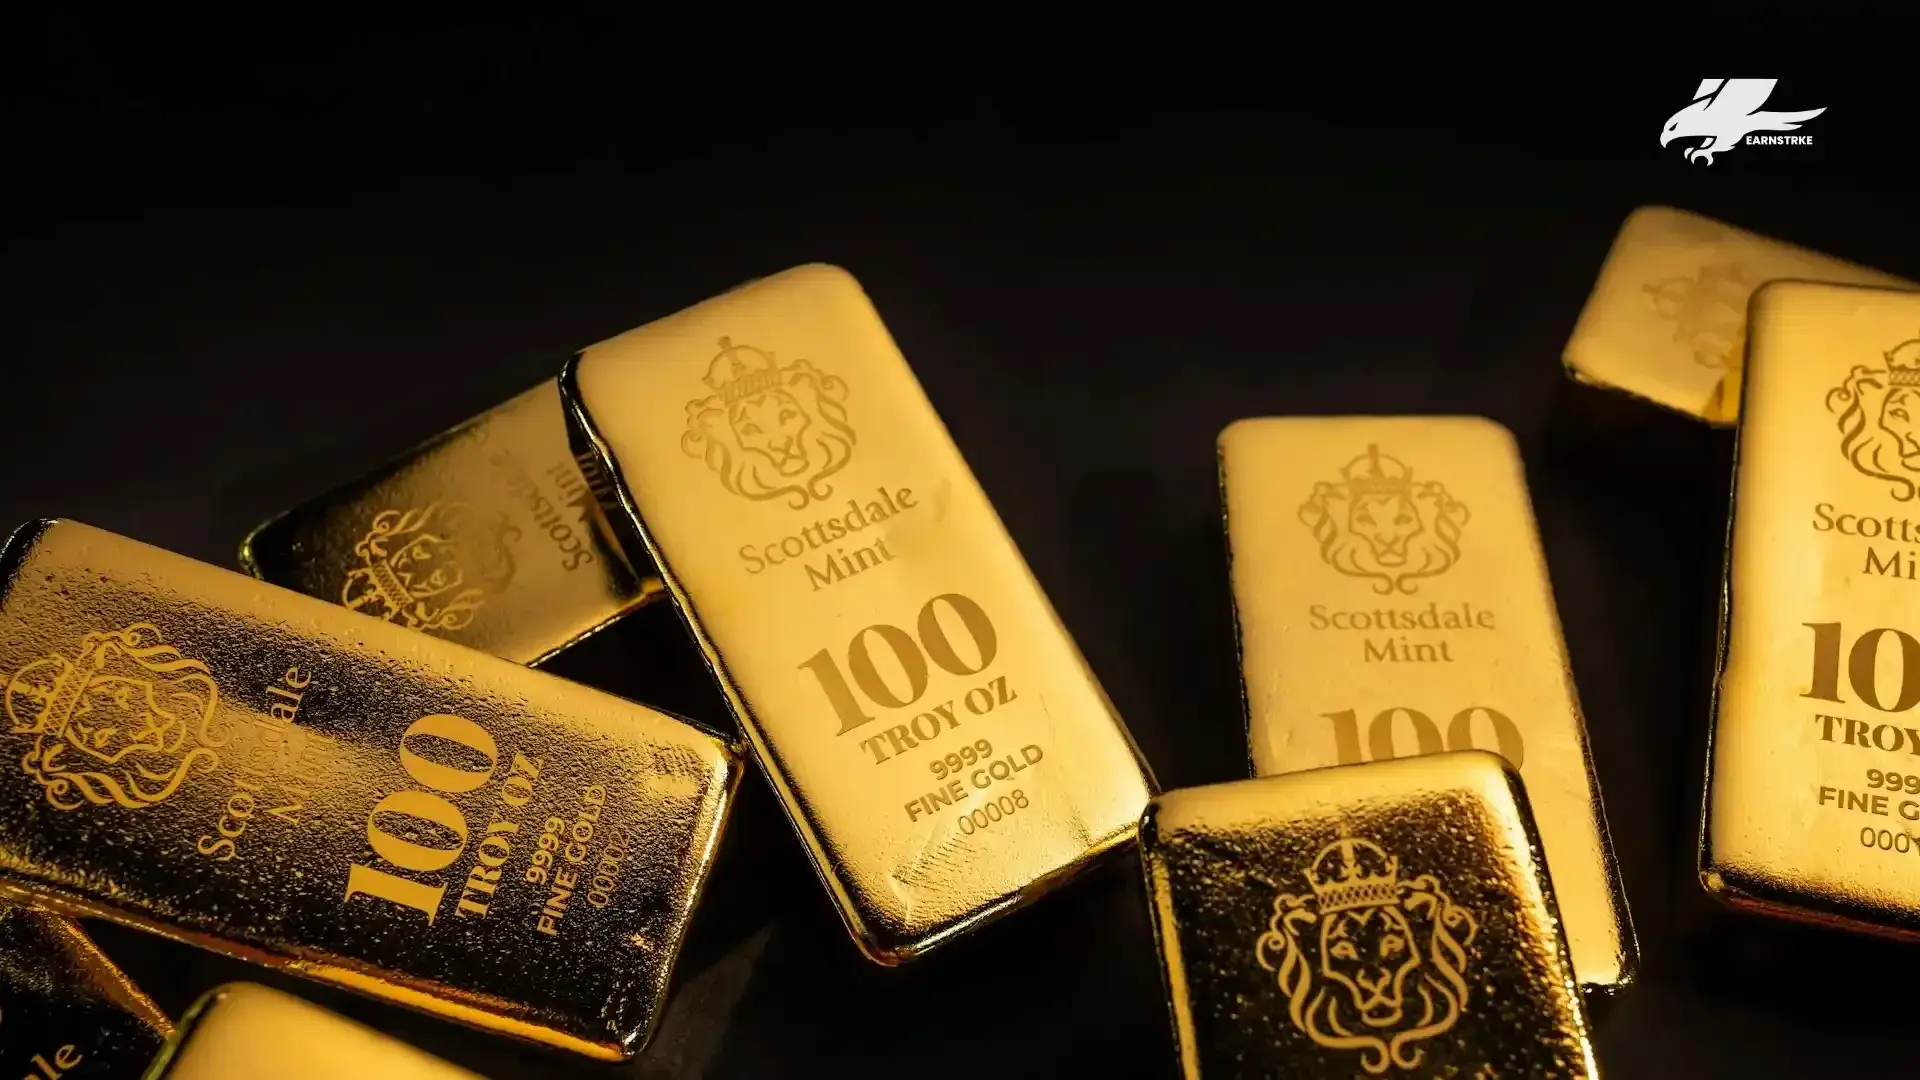
On June 26, 2026, spot gold rose 1% to $4,064.56 per ounce, recovering from its first break below $4,000 since November 2025, as easing rate hike bets and a softer dollar lifted prices — but the bigger story is a historic split between Western retail investors dumping gold and central banks accumulating it at a pace they're barely disclosing.
The headline is the rebound. The real story is what's happening underneath it.
Why Did Gold Drop Below $4,000 and Then Bounce Back?
Gold broke below $4,000 this week for the first time since November 2025, then recovered within days. The Fed's hawkish tone drove the dollar to its strongest level in over a year and raised expectations that rates would stay higher for longer. Gold is a zero-yield asset — when rates rise, the opportunity cost of holding it increases and money rotates out.
The bounce came after Thursday's PCE data. May inflation hit 4.1% year over year — the highest since April 2023 — but the month-over-month reading of 0.4% came in slightly below forecasts. That small undershoot trimmed rate hike bets. CME FedWatch now shows roughly 61% odds of a September hike, down from 69% before the data. The dollar softened, yields pulled back, and gold followed. Gold remains down roughly 5% year to date and 28% from its all-time high.
What Does the $12 Billion ETF Outflow Mean?
SPDR Gold Shares has seen roughly $12 billion in net withdrawals since late February — the largest four-month outflow in 13 years, according to Bloomberg data. This is Western retail and institutional money leaving. Rate hike fears reduce gold's appeal versus yield-bearing assets, margin calls force liquidations, and momentum-driven funds follow the move out the door.
What makes this outflow striking is what's happening on the other side of the trade.
Why Are Central Banks Buying Far More Gold Than They're Reporting?
In Q1 2026, central banks officially reported buying 16 tonnes of gold. The World Gold Council's actual estimate is 244 tonnes. That means 228 tonnes — 93% of total purchases — went unreported through IMF channels. This isn't a rounding error. It's a policy choice.
China's central bank has now bought gold for 19 consecutive months, accumulating more than 2,300 tonnes total. It bought straight through a 28% price crash that shook out most other investors. The strategic logic traces back to 2022, when Russia's dollar reserves were frozen. That moment showed every government outside the Western financial system that dollar assets in foreign accounts can be immobilized instantly. Gold in your own vault cannot. Since then, the accumulation has been relentless.
What Is China Doing With Its Domestic Gold Market?
This week, as gold broke below $4,000, Chinese state banks including ICBC moved to shut down retail leveraged gold trading — what the local market calls paper gold. Some institutions raised margin requirements to 140% before closing the products entirely. Physical gold was untouched. Coins, bars, savings plans, and ETFs all remain available. Only the leveraged paper contracts are gone.
The official reason is consumer protection, and that's partly true. But set the ban alongside 19 months of uninterrupted central bank buying and the picture becomes clearer: the state is accumulating physical metal while removing the mechanism through which citizens could drive a speculative paper price Beijing doesn't control. It is keeping the asset and closing the casino.
The Angle Most Coverage Is Missing
Western media is framing this week as a gold crash driven by rate fears. The more precise read is a forced liquidation of leveraged paper positions held by Western retail and momentum funds, being absorbed by sovereign buyers who don't care about short-term rate moves.
Peter Schiff noted this week that Bitcoin has fallen 60% against gold since its November 2021 peak — even as gold itself is down 28% from its record. For investors sold on Bitcoin as a superior store of value, nearly five years of data now runs the other way.
Western ETF investors pulled $12 billion out in four months. Central banks bought 244 tonnes in a single quarter while reporting only 16. One side is treating gold as a trade. The other is treating it as monetary infrastructure. The metal is physically moving from one set of hands to the other.
FAQ
Why Did Gold Fall Below $4,000 and Recover So Fast?
Gold broke below $4,000 after the Fed signaled rates could stay higher for longer, pushing the dollar to a one-year high. It recovered within days after PCE inflation data came in slightly softer month over month, trimming rate hike bets and weakening the dollar. Strong central bank demand at lower prices helped absorb the selling.
What Is the SPDR Gold Shares Outflow Telling Us?
GLD is the world's largest gold ETF and a reliable proxy for Western institutional demand. Its $12 billion outflow since late February is the largest four-month withdrawal in 13 years. ETF outflows don't eliminate gold demand — they transfer metal from paper holders to whoever is buying on the other side, which right now is largely sovereign buyers.
Why Are Central Banks Not Reporting Their Gold Purchases?
Central banks aren't required to report purchases immediately through IMF channels, and many choose not to for strategic reasons. Disclosing large accumulation programs can move markets and signal reserve diversification away from the dollar. The gap between 16 tonnes reported and 244 tonnes actually purchased in Q1 2026 reflects deliberate non-disclosure at a scale that changes how gold demand should be read.
Is Gold Still a Reliable Inflation Hedge If It's Down 5% This Year?
Gold's year-to-date decline reflects rate pressure, not a breakdown in its inflation hedge function. Higher real interest rates raise the cost of holding a zero-yield asset, which creates short-term headwinds. When that pressure eases, gold recovers quickly. Persistent central bank demand and a 59.8% gain over the past year suggest the structural case remains intact through the current pullback.
Commodities markets can be volatile and affected by global events. This content is for informational purposes only and should not be considered investment advice. Please read our Disclaimer for more information.